Beoogde eindgebruiker: Leraar, Lerarenopleider
Leeftijdsgroep: Hoger primair onderwijs; Lager secundair onderwijs
Schoolcurriculum: Wetenschap
Thema's en onderwerpen: Milieuverandering; Informatie en kennis
Duur: 2 x 50 minutes (plus optional extensions).
Type bron: Experiment, Audio/Video, Presentation, Simulation, Workshop
Trefwoorden: Bathymetric Mapping, Data Interpretation, Model-Based Inquiry Learning, Environmental Visualization, Systems Thinking
Talen: Engels
Beschrijving
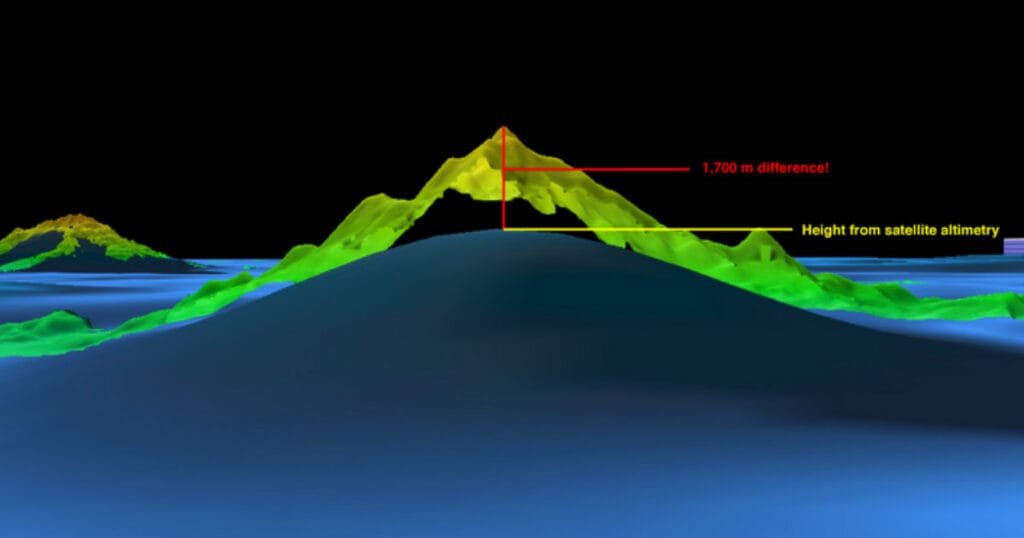
Wet Maps is an educational resource designed for middle school students (grades 6–8) that introduces the principles of bathymetric mapping—measuring and modelling the ocean floor using sonar technology. Through hands-on activities, students simulate multibeam sonar mapping by using sounding rods to gather depth data from a concealed seafloor model. They then analyze and interpret this data to create 2D graphs and a 3D paper model of underwater terrain. The lesson emphasizes the importance of sound over light in underwater exploration and develops key scientific practices such as modeling, data analysis, and system thinking. It incorporates cross-disciplinary learning in Earth Science, technology, and environmental education. The resource encourages critical thinking about oceanographic technologies and how scientists visualize and study submerged landscapes, supporting deeper environmental understanding and technological literacy. Extensions include exploring the history of ocean mapping and modern applications in marine science.
Hoe gebruik je deze bron
To use Wet Maps, begin by introducing students to sonar and ocean mapping using the included NOAA videos. Prepare seafloor model boxes with hidden features and grids, and provide each group with sounding rods, data sheets, and graph templates. Guide students to insert rods through the grid to collect depth data, record measurements, and graph each row using colour to indicate depth. After completing all rows, students cut and assemble their graphs to create a 3D paper model of the seafloor. Conclude with a class discussion on the accuracy and limitations of models, and connect the activity to real-world applications in marine science and sustainability. This resource supports inquiry-based learning, teamwork, and systems thinking, making it ideal for teaching both scientific method and environmental awareness.
De middelen
Wet Maps – teachers guide PDF:
Leerresultaten (Docenten)
- Eliciteren van voorkennis en verder ontwikkelen van kennis en begrip van de belangrijkste concepten van Duurzaam Burgerschap, waarbij gevestigde wereldbeelden en waarden in twijfel worden getrokken.
- een reeks geschikte hulpmiddelen en kaders toepassen om duurzaam burgerschap bij studenten te bevorderen
- Door middel van workshopactiviteiten en praktijkgemeenschappen capaciteit en agency opbouwen als docenten en leiders op het gebied van duurzaam burgerschap.
Groene competenties
- Duurzame waarden belichamen: Duurzaamheid waarderen; Natuur bevorderen
- Complexiteit omarmen in duurzaamheid: Systeemdenken; kritisch denken; probleemopstelling
- Duurzame toekomstvisies: Onderzoekend denken
Creative Commons
Wet Maps is adapted from educational materials provided by NOAA Ocean Exploration. Content includes publicly available resources such as multimedia, activity guides, and fact sheets designed for non-commercial educational use. All rights remain with the original source. No endorsement by NOAA is implied.
SDG's