Vorgesehener Endnutzer: Lehrer, Lehrerausbilder
Altersgruppe: Obere Primarstufe; Untere Sekundarstufe
Lehrplan der Schule: Wissenschaft
Themen und Fragestellungen: Umweltveränderungen; Information und Wissen
Dauer: 2 x 50 minutes (plus optional extensions).
Art der Ressource: Experiment, Audio/Video, Presentation, Simulation, Workshop
Schlüsselwörter: Bathymetric Mapping, Data Interpretation, Model-Based Inquiry Learning, Environmental Visualization, Systems Thinking
Sprachen: Englisch
Beschreibung
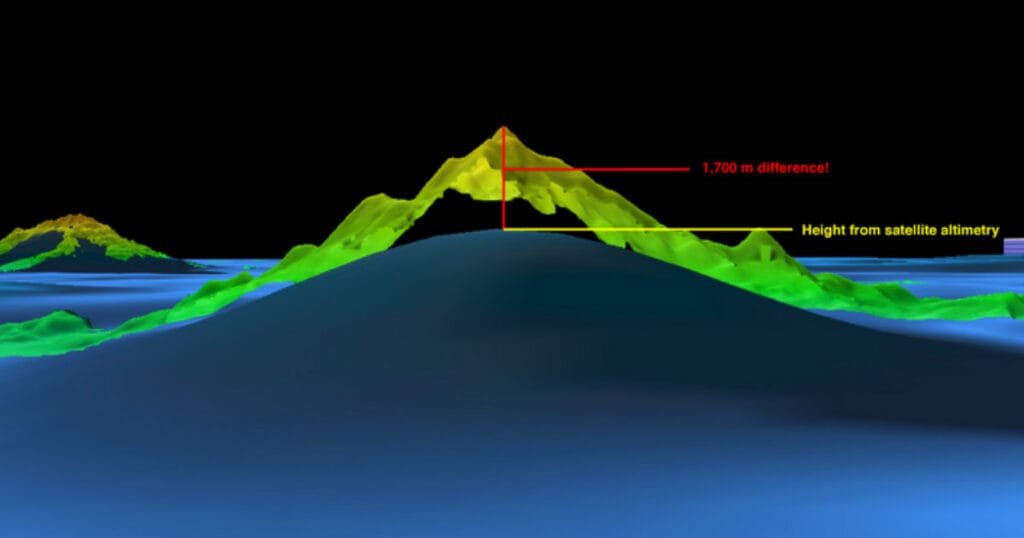
Wet Maps is an educational resource designed for middle school students (grades 6–8) that introduces the principles of bathymetric mapping—measuring and modelling the ocean floor using sonar technology. Through hands-on activities, students simulate multibeam sonar mapping by using sounding rods to gather depth data from a concealed seafloor model. They then analyze and interpret this data to create 2D graphs and a 3D paper model of underwater terrain. The lesson emphasizes the importance of sound over light in underwater exploration and develops key scientific practices such as modeling, data analysis, and system thinking. It incorporates cross-disciplinary learning in Earth Science, technology, and environmental education. The resource encourages critical thinking about oceanographic technologies and how scientists visualize and study submerged landscapes, supporting deeper environmental understanding and technological literacy. Extensions include exploring the history of ocean mapping and modern applications in marine science.
Wie Sie diese Ressource nutzen können
To use Wet Maps, begin by introducing students to sonar and ocean mapping using the included NOAA videos. Prepare seafloor model boxes with hidden features and grids, and provide each group with sounding rods, data sheets, and graph templates. Guide students to insert rods through the grid to collect depth data, record measurements, and graph each row using colour to indicate depth. After completing all rows, students cut and assemble their graphs to create a 3D paper model of the seafloor. Conclude with a class discussion on the accuracy and limitations of models, and connect the activity to real-world applications in marine science and sustainability. This resource supports inquiry-based learning, teamwork, and systems thinking, making it ideal for teaching both scientific method and environmental awareness.
Die Ressourcen
Wet Maps – teachers guide PDF:
Lernergebnisse (Lehrkräfte)
- Abfrage des Vorwissens und Weiterentwicklung von Wissen und Verständnis von Schlüsselkonzepten der nachhaltigen Bürgerschaft, wobei etablierte Weltanschauungen und Werte in Frage gestellt werden.
- Anwendung einer Reihe von geeigneten Instrumenten und Rahmenwerken zur Förderung des bürgerschaftlichen Engagements von Studierenden im Bereich Nachhaltigkeit
- Durch Workshop-Aktivitäten und Praxisgemeinschaften werden Kapazitäten und Handlungskompetenzen von Lehrkräften und Führungskräften im Bereich Sustainability Citizenship aufgebaut.
Grüne Kompetenzen
- Nachhaltige Werte verkörpern: Wertschätzung der Nachhaltigkeit; Förderung der Natur
- Komplexität in der Nachhaltigkeit berücksichtigen: Systemdenken; Kritisches Denken; Problemstellung
- Visionen für eine nachhaltige Zukunft: Forschendes Denken
Creative Commons
Wet Maps is adapted from educational materials provided by NOAA Ocean Exploration. Content includes publicly available resources such as multimedia, activity guides, and fact sheets designed for non-commercial educational use. All rights remain with the original source. No endorsement by NOAA is implied.
SDGs